Financials
Confirmed Model Structure
The model structure for Revenue(t), Cost(t), sensitivity bands, and tier-based CAC logic is adopted across the suite and is in active use for planning.
Assumptions Pending Validation
ARPU by tier, retention-curve inputs, and final quarterly burn values remain open until the live spreadsheet model is fully populated.
Revenue model
Per market, per Pillar I:
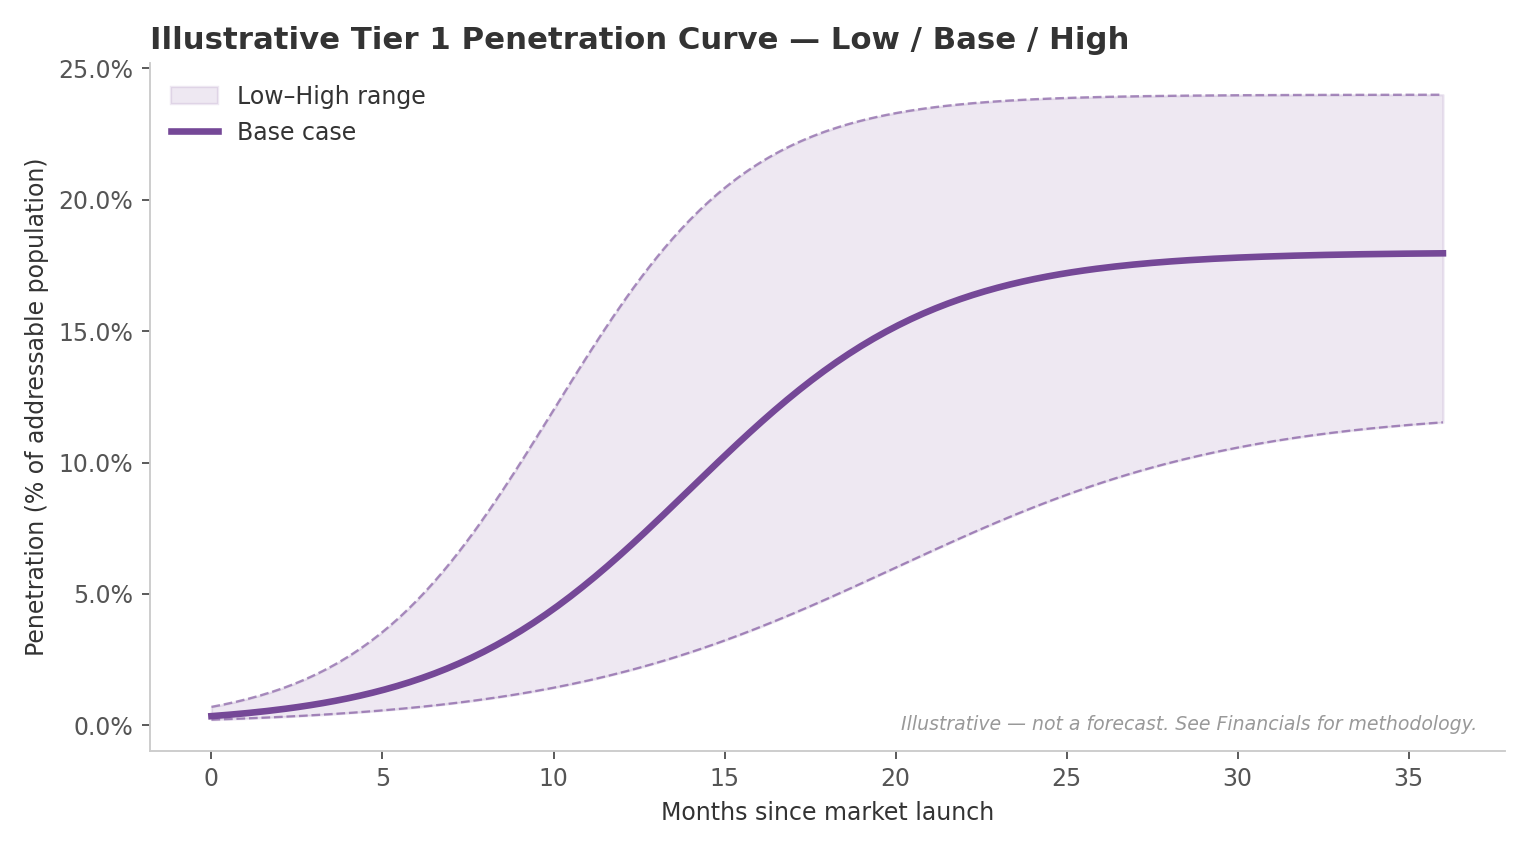
Revenue(t) = Addressable_Population × Penetration(t) × Blended_ARPU
Cost(t)    = CAC × New_Users(t) + Localisation_Fixed_Cost + Compliance_Fixed_Cost
Blended ARPU is deliberately not a single number — it separates three mechanisms that scale differently by market, per Pillar I:
| Revenue line | Scales with | Notes |
|---|---|---|
| Advertising / sponsored content | Engagement, regional ad-rate benchmarks | Historically variable 3–5x across mature vs. emerging ad markets |
| Subscription / premium tier | Disposable income, willingness-to-pay norms | Expected to differ materially UK/US vs. Nordic vs. Gulf |
| Fundraising take-rate | Local charitable-giving culture, average fundraiser size | The differentiated line — directly tied to the GoFundMe integration; see Pillar V: Philanthropy & Impact |
Cost model & CAC
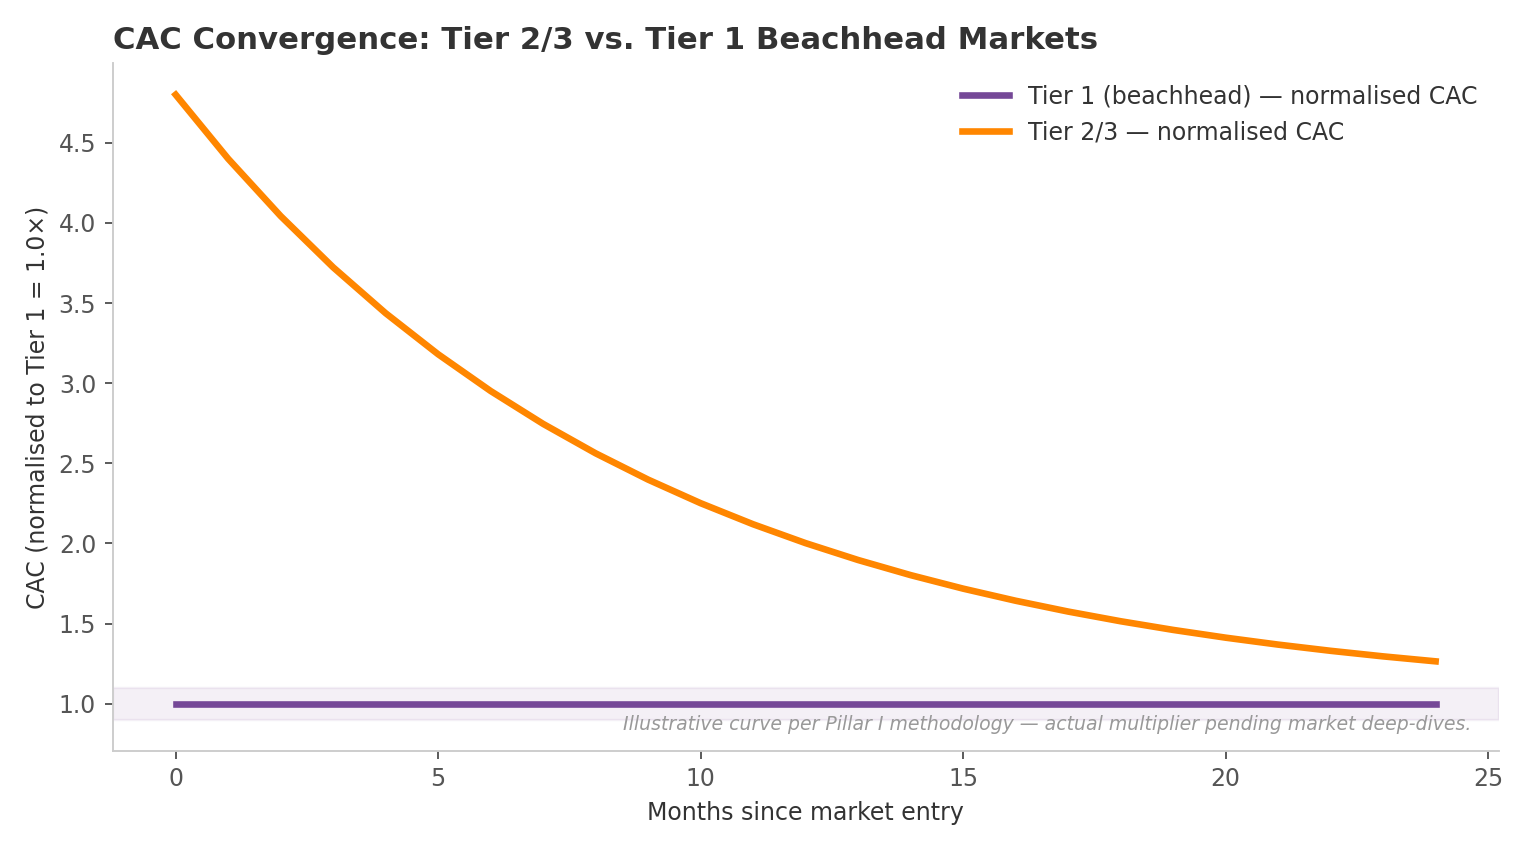
CAC is modelled with an explicit Tier 1 vs. Tier 2/3 multiplier: typically 3–5x higher outside beachhead markets in year one, converging toward Tier 1 levels only after 18–24 months of brand-awareness compounding (per Pillar I). A single global CAC assumption is flagged there as the single most common error in early-stage international-expansion modelling — this plan does not make that error, and any future version of this document should preserve that discipline.
One further wrinkle worth modelling explicitly once real data exists: Shimmy's invite-only launch (see Compounding Growth & User Psychology, Loop 4) should suppress paid CAC materially during the invite-gated period, since growth is deliberately routed through invitation-based, near-zero-marginal-cost distribution rather than paid acquisition. The burn model below should treat early-period CAC as a distinct, lower-cost regime from the post-expansion CAC figures above, not blend them into one curve.
Burn & runway
| Quarter | Headcount cost | Infra & tooling | Other opex | Monthly burn | Cumulative | Runway remaining |
|---|---|---|---|---|---|---|
| Q3 2026 | — | — | — | — | — | — |
| Q4 2026 | — | — | — | — | — | — |
| Q1 2027 | — | — | — | — | — | — |
| Q2 2027 | — | — | — | — | — | — |
This table should be driven directly from the £1,000,000 raise and the use-of-funds allocation — the runway figure here is what determines whether the milestone dates in Roadmap & Milestones are actually achievable before the next raise is needed.
Unit economics
| Metric | Definition | Current value |
|---|---|---|
| CAC (Tier 1) | Cost to acquire one user in beachhead markets | To be confirmed |
| CAC (Tier 2/3) | Cost to acquire one user outside beachhead markets (3–5x Tier 1 in year one) | To be confirmed |
| LTV | Present value of blended ARPU over expected retention | To be confirmed |
| LTV:CAC ratio | Standard health check | To be confirmed |
| Payback period | Months to recover CAC from cumulative ARPU | To be confirmed |
| Donation completion uplift | Increase in fundraiser completion rate vs. baseline platforms | To be confirmed |
Sensitivity — bands, not point estimates
Consistent with Pillar I: every market projection in this plan should ship as low / base / high bands, driven primarily by penetration-curve steepness and CAC-convergence speed — the two inputs with the widest genuine uncertainty. Pillar I is explicit that a single-point five-year revenue forecast for a market Shimmy hasn't entered yet is not a credible artefact for board or investor purposes. This document inherits that standard; any figures added here should arrive with bands and stated assumptions, not as bare numbers.